Analysis Paper
One Year On:

Romania's fiscal adjustment has been complicated, only partly efficient, with no support to economic growth. Fiscal adjustment needs a reset to jumpstart the economy.

What the first seven months of 2026 tell us about the 2025 fiscal package — and how it compares with what CPAG proposed in June 2025.

By Laurian Lungu, President · Consilium Policy Advisors Group · office@cpag.ro · www.cpag.ro

September 2026 Jan–Jul 2026 budget execution Follow-up to 4 June 2025

Key findings at a glance

What the budget execution data for the first seven months of 2026 show, one year after the fiscal package

+0.8 pp
VAT gain, as a share of GDP
Rolling 12 months to July 2026 — more than the entire +0.7 pp net rise in fiscal revenue
−2.3%
Budget deficit, Jan–Jul 2026
Of estimated 2026 GDP — down from a 9.3%-of-GDP peak in 2024
−65,000
Jobs lost over the last year alone
1.3% of total employment; unemployed up 10%; ≈ RON 2.5 bn/year fiscal cost
−0.5%
GDP growth, average of the last three quarters
Only 1.0% a year on average since 2023 — its lowest, during the PNRR inflow
−0.2 pp
SSC, as a share of GDP
11.1% → 10.9% despite repeated broadening of the CASS base
≈ 42%
Current government spending, % of GDP
Still far too high — real cuts, not inflation, must offset any relief
01 · Introduction

One instrument out of a dozen did all the work

In our paper “Fiscal Adjustment Must Be Simple, Efficient, and to Support Economic Growth” (with Ella Kállai and George Ștefan, 4 June 2025), we proposed what the title suggested: a simple fiscal reform based on economic logic, namely increasing the tax on consumption but balancing this with a small cut in labour costs and no increase in capital taxes.

One year on, the effects of fiscal policies implemented by the authorities show that essentially one instrument, out of roughly a dozen, did all of the work, namely the VAT increase. Budgetary results for the first seven months of 2026 show that we were right. VAT gains accounted for 0.7% of GDP while current revenues rose by only 0.4% of GDP. Compared to the same period a year ago, profit tax and social contributions are virtually flat as a share of estimated GDP; the dividend tax's apparent 2025 gain is very likely a one-off pulled forward ahead of the 16% rate; the turnover taxes and the construction tax raise revenue but not enough, relative to their size and the number of times they were touched, to show up as anything more than rounding in the execution totals.

Figure 1. Government revenues as % of GDP, rolling 12 months Aug 25–Jul 26 vs Aug 24–Jul 25

Source: CPAG calculations using Ministry of Finance, INSSE, NBR data and own estimates for GDP in 26Q2.

View the original figure from the paper Original Figure 1 from the CPAG paper: government revenues as a share of GDP
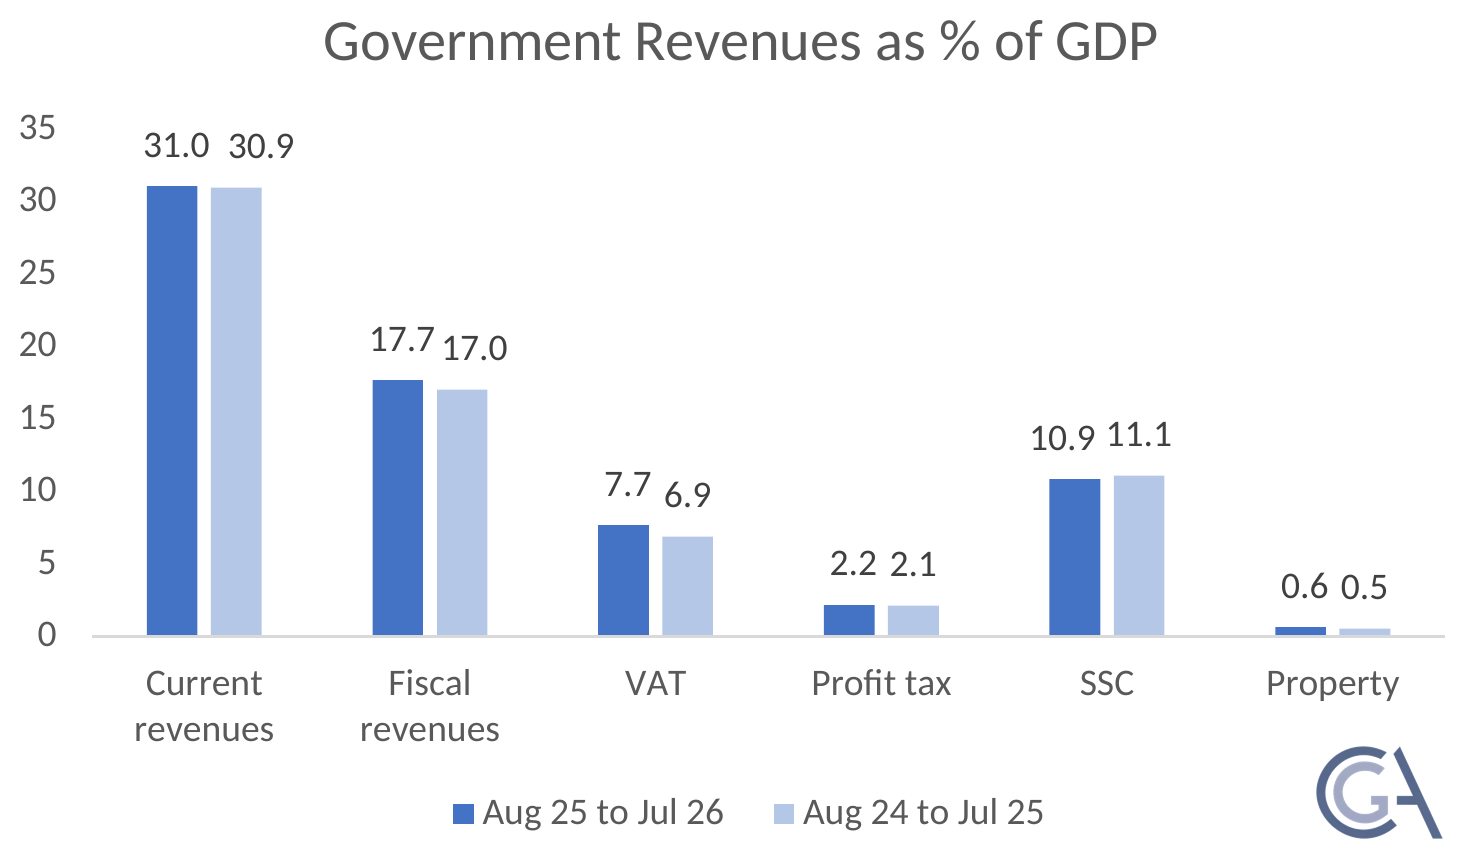
Taking a rolling-12-month view (i.e. comparing revenue data for the period Aug 25–Jul 26 against the Aug 24–Jul 25 period) actually sharpens the results. Although these are only partial results, based on the 2026 Q2 GDP estimate, they actually outline a trend.

The most striking thing is that VAT alone (+0.8pp of GDP) accounts for slightly more than the entire net increase in fiscal revenue (+0.7pp). That is only possible because something else fell: in our preliminary estimates SSC actually declined as a share of GDP, from 11.1% to 10.9% (−0.2pp). This is notable given how much of the 2025 measure list was aimed at broadening the CASS base. None of that shows up as a net revenue gain here — if anything, the ratio moved the wrong way. Profit tax (2.1%→2.2%) and property (0.5%→0.6%) are both essentially flat, each contributing a rounding error's worth of GDP. So on a full rolling year, VAT is not just the biggest riser — it is doing more than 100% of the work, with everything else roughly cancelling out.

Scheme 1. Where the extra revenue came from — change in each item, pp of GDP, rolling 12 months
Revenue itempp of GDPReading
VAT 6.9% → 7.7% of GDP+0.8 ppDoing more than 100% of the work
Social contributions (SSC) 11.1% → 10.9% of GDP−0.2 ppFell despite repeated base-broadening
Profit tax 2.1% → 2.2% of GDP+0.1 ppEssentially flat
Property taxes 0.5% → 0.6% of GDP+0.1 ppEssentially flat
Fiscal revenues, total 17.0% → 17.7% of GDP+0.7 ppNet result: everything other than VAT roughly cancels out
Source: CPAG calculations using Ministry of Finance, INSSE, NBR data and own estimates for GDP in 26Q2. Figures rounded to one decimal.
Figure 2. GDP growth, % change vs same period a year ago Period averages
5.9%
2016–17
4.3%
2018–19
2.2%
2020–22
1.0%
2023–26

Source: CPAG calculations from the INSSE data. Over the last three quarters, growth has averaged −0.5%.

View the original quarterly figure from the paper Original Figure 2 from the CPAG paper: quarterly GDP growth, 2016 to 2026
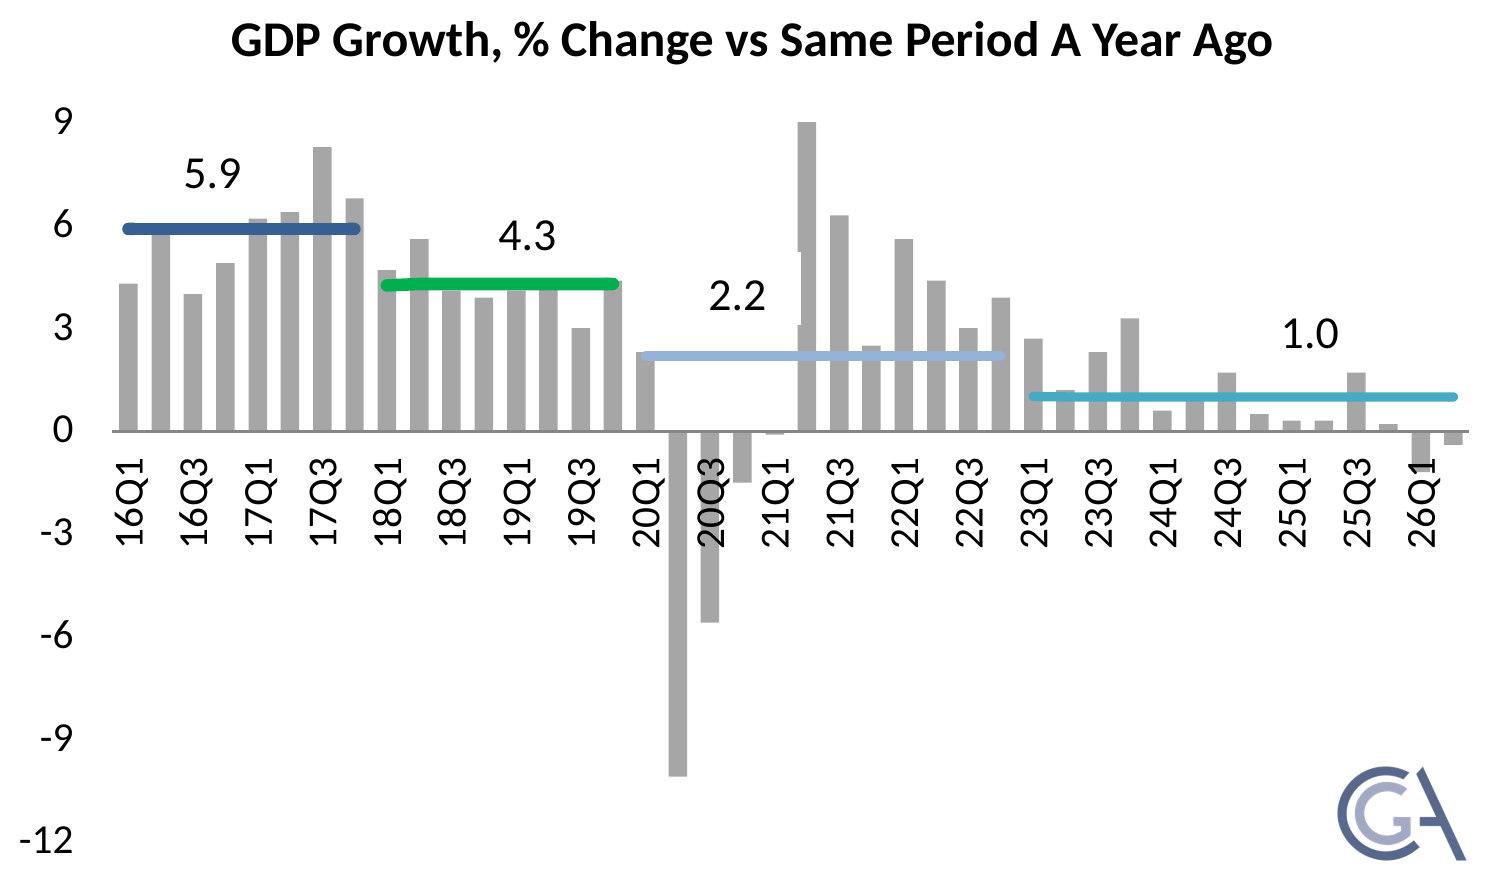
The economy is on a decelerating path, averaging −0.5% growth over the last three quarters. This is to be expected given a fiscal consolidation of this scale. But the real worry is that the fall in trend economic growth has been consistent over the last decade. And in a period in which Romania benefited from one of the largest inflows of free capital, via its National Recovery and Resilience Plan (PNRR), average growth was at its lowest, at only 1%.

The economy also lost almost 65,000 jobs over the last year (1.3% of total employment), pushing up the number of unemployed by 10%. Those job losses were largely occurring in the private sector. This explains why the broadening of the SSC base did not yield the results the authorities anticipated. The economy seems to have now reached a point where any increase in taxes threatens to bring in less revenue and slow economic growth further.

The real progress has been achieved by reducing the government's budget deficit to −2.3% of estimated 2026 GDP during the first seven months of the year. This was indeed the main purpose of the reform. But there are different paths to achieve the same outcome, some entailing lower costs than others. The risk now is that the effects of government measures will create a permanent supply destruction, pushing future GDP growth potential even lower while reducing Romania's competitiveness. Coupled with the potential negative shocks coming from abroad in the near future, the situation could become even bleaker.

That should have been the starting point for the initial policy design. What actually happened across four legislative vehicles in three years was the opposite of a philosophy: taxes on labour, capital and consumption were all raised, more or less simultaneously, with no attempt to sequence them, to protect the bases with the better growth trade-off, or to give the economy any respite. Each package reads as a response to that year's budget gap rather than as part of a considered view of which taxes Romania could raise without damaging the recovery it needed. That was purely an accounting exercise. It was not economics, which would have asked what each instrument's behavioral response and growth cost actually were before choosing between them.

The VAT gap is the clearest evidence that this was not about matching the instrument to the objective. The enforcement push we advocated has not yielded any tangible results so far. The government rightly chose to increase the effective VAT rate, but the slower structural work of actually collecting VAT is largely not visible. Given that VAT is the one instrument that is actually working, a stalled VAT gap is not a side issue — it is the single largest remaining source of revenue, one that would not require another tax increase on labour or capital at all.

02 · What was actually implemented vs our economic philosophy

Four legislative vehicles, three years, taxes raised on every base

Annex 1 lists the measures adopted over the past three years, splitting them into labour, consumption and capital/property. Taxes were raised across all these categories with no clear economic strategy in sight, hurting future growth and making economic recovery conditions much more difficult.

Table B. Measures adopted 2023–2026, by economic base (from Annex 1)
Economic baseDistinct measuresDirection of travelMain legislative vehicles
A. Labour income tax, CAS/CASS, minimum wage6Up — base broadened in 2023, 2025 and again for 2026; the only relief is the tax/CAS-free allowance at the minimum wageLaw 296/2023; OUG 156/2024; Law 141/2025; Law 239/2025
B. Consumption VAT, excises, gambling5Up — VAT raised and restructured, excises widened; e-invoicing is a compliance measure, not a rate changeLaw 296/2023; Law 141/2025; Law 239/2025
C. Capital / business turnover taxes, dividend tax, micro-enterprise regime7Up — the most frequently amended base; dividend tax raised three times since 2022; only the oil & gas ICAS lapsedOG 16/2022; Law 296/2023; OUG 156/2024; Law 141/2025; GEO 89/2025; Law 239/2025
D. Property real estate, vehicles3Up — luxury tax tripled, taxable values revalued and raised, reduced rates for legal entities removedLaw 296/2023; local tax reform; Law 239/2025
Source: CPAG, from Annex 1.

Two patterns stand out. First, capital/business is the most frequently amended base: seven distinct measures, several of them touched more than once, with the direction almost uniformly upward — every turnover tax introduced from 2024 was still in place in mid-2026, and the dividend tax was raised three times since 2022. The one genuine piece of capital-side relief in the whole record is the oil & gas turnover tax (ICAS), quietly allowed to lapse at end-2025 rather than renewed.

Second, on labour the direction only ever goes one way: the 2023 law broadened the CASS base (vouchers, sectoral exemptions), the August 2025 package removed the remaining exemptions and added a new levy on higher pensions, and Law 239/2025 broadened it again for 2026, raising the self-employed CASS cap and closing the last co-insurance exemptions, while the only genuine relief anywhere in the record, the minimum-wage tax/CAS-free allowance, is narrowly targeted at the bottom of the wage distribution.

Our June 2025 note argued for a narrow, contingent package: a temporary VAT increase paired with VAT-gap enforcement, a cut (not a rise) in social contributions, and elimination of the turnover and construction taxes. The government's actual package, finalised two months later in Law 141/2025, moved in the same direction on VAT and on the profit-tax rate, but in the opposite direction on almost everything else. The practical effect is that the 2025–26 package is broader and more evenly spread across consumption, labour and capital than the package we proposed. This is exactly the combination we warned had “a high cost-benefit ratio” and “lacks economic logic.”

Table 1. CPAG proposal (4 June 2025) versus what was actually implemented

Open any dimension to compare side by side.

Source: CPAG.

03 · The hidden cost: rising unemployment and the budget

Every job lost now costs the budget somewhere between RON 2,100–5,100 a month

Tighter labour demand is itself costing the budget. The simultaneous increase in labour costs and consumption taxes was likely the main factor behind the loss of 65,000 jobs over the last year alone. At the same time, the unemployed count rose by 10%, or 51,000 — implying that the roughly 14,000 gap between the two figures reflects people leaving the labour market altogether, rather than being counted as unemployed, and raising the risk of structural unemployment. This comes at a time when youth unemployment is itself on the rise, with almost one young person in three out of work.

Table 2. Fiscal cost of job losses — per redundant worker and annualised over 65,000 redundancies
Per additional redundant workerMinimum wageAverage wage
Gross wageRON 4,100/monthRON 9,700/month
Forgone CAS + CASS + income tax + employer CAMRON 1,600/monthRON 4,100/month
Total forgone VATRON 300/monthRON 700/month
TOTAL forgone revenue + benefit cost, per person/monthRON 2,100RON 5,100
Annualised over 65,000 redundancies≈ RON 1,600 million≈ RON 4,000 million
As % of 2026 GDP≈ 0.08%≈ 0.19%
Per-person monthly costing includes the forgone CAS/CASS/income tax and employer CAM, forgone VAT on 80% of net wage split 20%/60% between utilities and other consumption at 11%/21% VAT rates, and the expected-value unemployment benefit at 22% coverage. Source: CPAG calculations.

The true figure would likely sit in the lower half of the range, closer to the minimum-wage bound than the average-wage one, probably around RON 2.5 bn or even more. For policy, the implication is that the hidden fiscal offset from labour-market deterioration is quite large. The calculation excludes further second-round effects (weaker household spending feeding through to profit tax and to other households' incomes), which would push the true cost higher. Moreover, the trend is likely to continue in the coming months if specific policy actions to reverse it are not taken. This should strengthen the case for SSC relief and a lower non-wage cost of labour.

Key takeaway

Labour-market deterioration is no longer a side effect of the adjustment: at between 0.1–0.2% of GDP a year in forgone revenue and benefit costs, it is a fiscal item in its own right — and one that argues for lowering, not raising, the non-wage cost of labour.

04 · Fiscal options to relaunch the economy

A specific policy menu, offset by real spending cuts

The findings from above point toward a fairly specific policy menu: consumption and property taxes are doing the revenue work; capital and labour taxes are largely not, once the dividend-tax pull-forward is accounted for; and the labour market is now generating a real, growing fiscal cost of its own that argues for treating labour costs, not just headline tax rates, as a policy lever. On that basis:

1

Treat the 2025 dividend-tax windfall as one-off, and be ready to revisit the 16% rate once 2026 data are in

Collections nearly doubled in 2025 (from RON 5.81bn to RON 10.33bn), but a large part of that was entrepreneurs pulling distributions forward to beat the January 2026 rate rise — revenue collected once, not a repeatable base. Budgeting on the assumption that ~RON 10bn/year is the new normal risks a shortfall once the pulled-forward stock is exhausted. If full-year 2026 collections come in structurally weak relative to a “no front-loading” counterfactual, that would be the real evidence of the poor cost-benefit ratio we warned about, and the case for reverting toward 10% rather than holding at 16%. This would give a breathing space for a large number of small and medium enterprises which have been operating on very thin margins.

2

Deliver the SSC relief

A 1pp cut in social contributions or more, or a cap on contributions for non-salary income at a multiple of the average wage, would partially offset the real-wage hit from the VAT increase, support formal employment, and directly address Romania's above-EU-average tax wedge. Every incremental job lost is now costing the budget on the order of RON 2,000–5,100 a month, depending on the wage level, once forgone payroll tax and the VAT on lost consumption are both counted, so a policy that keeps the labour cost of hiring down is not just a competitiveness argument, it is a fiscal one as well.

3

Shift enforcement to close the VAT gap

Romania's VAT gap still remains the highest in the region by a wide margin. ANAF digitalisation, full follow-through on e-invoicing, and targeted anti-evasion tools (such as the deposit-at-registration mechanism used in the Czech Republic for high-risk sectors, which our paper cites) would let the state collect more of the VAT already legislated.

4

Target support to local producers narrowly and temporarily, prioritising the small and medium-sized enterprises that have absorbed this cycle hardest

SMEs have been squeezed from both directions at once: the large dividend tax rise falls disproportionately on them because owner-distributions are how most SME profits reach their owners, unlike larger firms with more scope to retain and reinvest earnings. And the VAT increase to 21%, together with higher utility and input costs, has hit domestically-facing SMEs as a genuine sales-volume problem, not just a margin squeeze, since their customers are the same households absorbing the same price rises. The right instruments are SME-specific rather than broad handouts: faster, simplified VAT refund cycles for SME manufacturers and exporters; accelerated depreciation for domestic manufacturing investment; and a capped, temporary relief on the dividend tax specifically for profits retained and reinvested in the business.

5

All of the above measures should be offset by real cuts in government spending

Relying on inflation alone to do the job — letting spending erode in real terms — is not a viable option, since current government spending, at close to 42% of GDP, is already far too high.

CPAG recommendation, June 2025 — Verdict pending

Do not raise the dividend tax further

CPAG cautioned in June 2025 against raising the dividend tax further. Receipts nearly doubled in 2025, but this was largely a pull-forward ahead of the 16% rate. Full-year 2026 collections, compared with a “no front-loading” counterfactual, will settle the verdict — and, if weak, make the case for reverting toward 10%. What is more important however, is the fact that this large increase in dividends tax was hugely counterproductive. Bankruptcies and unemployment rose, consumption contracted while the net impact on fiscal revenues was negative.

05 · Strategic considerations for the fiscal options

Composition, external exposure, fatigue, growth, credibility and the electoral cycle

Open any consideration to read it in full.

Table C. Why rising global yields matter more for Romania
IndicatorRomania, 2026What it means
Gross financing needs≈ 14% of GDPAn unusually large annual refinancing need exposed to global repricing
Interest payments~ 3% of GDPInterest alone will consume around 3% of GDP in 2026
10-year government bond yield≈ 7.5% → 6.6%Compression earned by demonstrated fiscal discipline — and fragile
Investment-grade ratingHeld “merely by the credibility of the deficit reduction path”A downgrade to junk would be a step change in financing costs
10-year US Treasury yieldHighest since November 2023The global bond sell-off is the external trigger
Source: CPAG.

Scheme 3. The consolidation path — a seven-year project, first half delivered

−9.3%
2024
Deficit peak, % of GDP — starting point of the seven-year consolidation
−2.3%
Jan–Jul 2026
Deficit in the first seven months, % of estimated 2026 GDP — the “remarkable achievement”
≈ −6%
End-2026 (est.)
Full-year estimate; debt still projected to rise
< −3%
2031 target
Remaining gap must come from structural spending reform or a second round of tax rises
Phase 1 — delivered

2024 → mid-2026

Revenue-heavy, VAT-driven; deficit down sharply.

Phase 2 — structurally harder

2026 → 2031

Public wage bill, pension indexation, SOE subsidies — or a second round of tax rises on an already-raised base.

Source: CPAG.

Key takeaway

The first phase of the consolidation has been delivered, and the deficit path — not the deficit number — is what holds the investment-grade rating in place. The second phase needs legislated, multi-year measures on the spending side, paired with growth-restarting measures; further ad hoc emergency ordinances are now a bigger risk than a year ago.

A2 · Annex 2: Scorecard — CPAG's June 2025 proposals, one year on

What CPAG proposed, what the government did, and what the data show one year on

Table A. Filter by verdict, then open any row.

Source: CPAG; the June 2025 proposal is available at cpag.ro.

Stay Informed

Subscribe to receive CPAG's latest research and policy insights.

© CPAG — Consilium Policy Advisors Group. All rights reserved.